
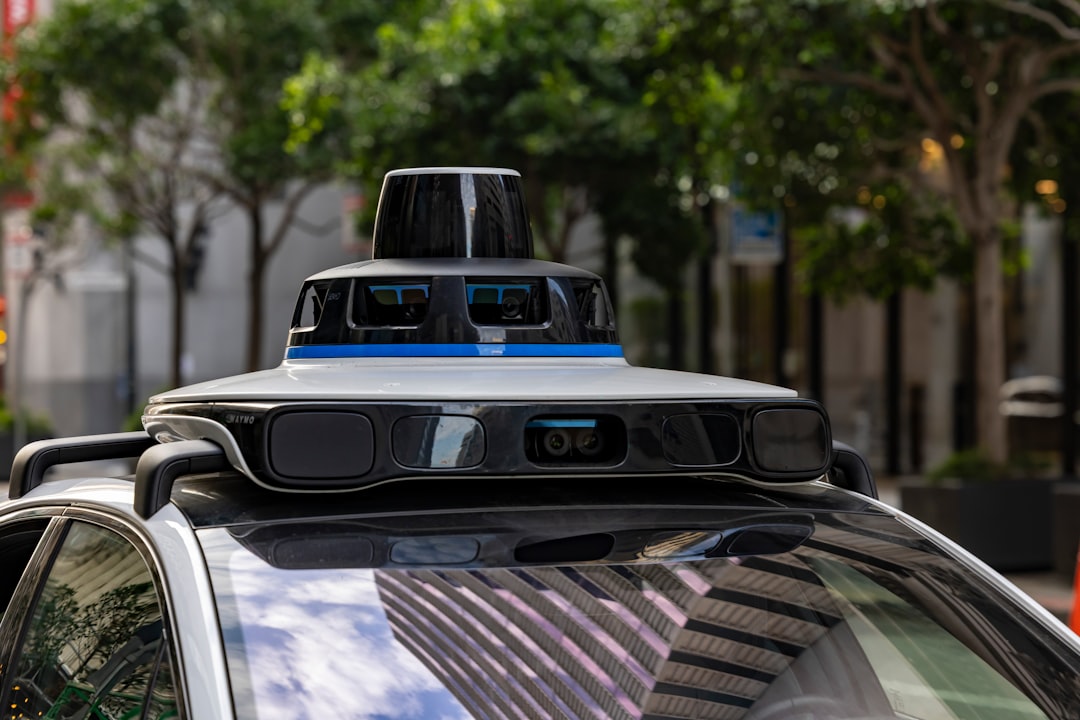
On June 24, 2026, Waymo published a safety update covering more than 220 million fully autonomous miles, running through the end of March 2026. It spans five operating areas, and Atlanta appears for the first time. The method is simple to state: Waymo compares its crash record with estimated human-driver rates in the same areas and period, regardless of who was at fault.
It’s worth being clear about who is doing the counting. This is Waymo’s own analysis, published on its blog and safety hub, and not an audit by a regulator. The hub describes methods from peer-reviewed papers and links the data, but this specific release is a company analysis. Waymo has since posted a newer update, on September 24, 2026, covering about 270 million miles through June 2026, so everything below describes an earlier snapshot.
What Waymo reported
Against the human benchmark, Waymo reports 94% fewer serious or fatal injury crashes, 82% fewer airbag-deployment crashes, and 82% fewer crashes with any reported injury. For vulnerable road users the gaps are 93% fewer pedestrian injury crashes, 84% fewer cyclist injury crashes, and 84% fewer motorcyclist injury crashes.
In Atlanta, which had over 5.4 million miles, a typical human driver would have been expected to have about 1.2 serious or fatal injury crashes. The Waymo Driver had none.
Atlanta also shows 94% fewer airbag-deployment crashes and 86% fewer injury crashes, by Waymo’s count. Over its whole operating history, Waymo converts the rates into estimated counts: about 47 fewer serious or fatal injury crashes, about 305 fewer airbag-deployment crashes, and about 707 fewer injury crashes than the benchmark would predict. At more than 4 million miles per week, it estimates roughly one fewer serious-injury crash every eight days.
Waymo credits redundant sensors, an independent validation layer that checks each planned path against traffic rules and physics, and large-scale simulation. Its August 26, 2026 engineering post describes these methods but includes no crash statistics.
A separate Swiss Re study (December 2024) looked at insurance liability claims over 25.3 million Waymo miles. It found 88% fewer property damage claims and 92% fewer bodily injury claims than a human-driver baseline. Waymo had 9 property damage claims and 2 bodily injury claims.
Why It Matters to You
If you ride or share the road with Waymo vehicles in its five operating areas, these figures are the company’s evidence that its cars crash less often than human drivers in those places. They’re a company analysis, not an independent finding, and they don’t speak for other cities or other companies’ vehicles.
What the figures leave out
- The “fewer crashes” counts are estimates. They compare Waymo’s observed crashes with expected human crashes, and nobody observed the human crashes that did not happen.
- Waymo published the analysis itself. Its page notes that human and Waymo data sources differ, and that the methods try to make the comparison like for like.
- The figures cover only Waymo’s five operating areas.
- Waymo’s safety hub says its cities have no appreciable snow, so winter driving is not represented.
- The September 24, 2026 update covering 270 million miles through June 2026 supersedes these numbers.
Quick answers
Are these the latest Waymo numbers?
No. Waymo posted a newer update on September 24, 2026, covering about 270 million miles through June 2026.
Does this prove robotaxis are safer than people everywhere?
No. It compares Waymo with estimated human rates in specific areas. It doesn’t cover other companies, other places, or conditions such as snow.
Sources
- Waymo: From the road, June 24, 2026 (Jun 24, 2026)
- Waymo: Safety Impact data hub (accessed Oct 13, 2026)
- Waymo: 10 AI Lessons from Driving 200+ Million Fully Autonomous Miles (Aug 26, 2026)
- Electrek: Study shows Waymo’s robotaxi platform provides significantly higher safety performance than human drivers (Dec 19, 2024)